Aims and introduction
We want know if AI can automate data extraction tasks at a sufficiently high level of accuracy to reduce the manual data extraction work required by humans.
More specifically, we want to know how much data we need to extract by hand, and how much prompt iteration we need to do, in order to achieve a sufficiently high level of performance.
We also want to know how much manually extracted data we need to have in order to prove - with a given level of confidence - that the automated process achieves our required level of performance.
How to evaluate
Evaluation works by comparing data extracted by humans (also known as the ground truth) to data extracted through our automated process.
We use evaluation metrics to quantify the extent to which the automatically extracted data match the ground truth data.
Some important considerations for data extraction:
Class imbalance
Some attributes of interest may only appear very infrequently, meaning that accuracy can be misleading. Consider using a variety of metrics, including precision, recall, and their average, the F1 score.
Non-binary errors
If we are deciding whether a record belongs to a particular category, an automated process can either get this right or wrong. For some data extraction tasks, such as effect size extraction, we can get this right, wrong, or very wrong. We need to think carefully about how to measure this kind of wrongness.
Splitting data for training, optimising, and evaluating
In traditional machine learning, we split our data into 3 separate parts: the training set, the validation set and the test set. The training set is used to train a model. Because the first model we train may not be the best model, we may want to explore alternative models, or alternative model specifications (e.g. by varying model hyperparameters). We can train each of these candidate models on the training set, and measure how well each performs using the validation set. Finally, we select the model specification that performs best on the validation set, and evaluate how well it performs on the test set. This test set is held-out from the whole process of developing our model, and is only used once, once we have finished making all decisions about our model and how it is specified.
Why do we split training, validation, and test sets?
We evaluate in order to estimate the performance of our model on data we have not seen before. We want to understand how well our model will generalise to new data.
The process of optimising our model, whether that is by training it, or by assessing different specificiations or model types to see which works best, usually improves performance. However, it is possible to overfit our model, meaning that it is highly sensitive to individual data points in the data we have seen, at the expense of generalisability. If we try several different combinations of hyperparameters and find that one combination increases our accuracy by 5 percentage points to 95%, there is no guarantee that our model’s performance on new data will be 95%. In fact, this is likely to be an overly optimistic estimate of performance.
In order to obtain an unbiased estimate of the performance of our model, we must use data that we have never used to train or make any decisions about our model.
Though using an LLM means we do not have to train a model (and therefore we do not need a training set), we do have choices to make about which model we use, and how we prompt the model. Both of these choices are likely to affect how well our model performs, and as such we can approach prompt engineering in a similar fashion to how we do hyperparameter optimisation. If we want to use data to inform these choices, then we must be sure to keep this data separate from any data we use to evaluate the likely performance of our model. We therefore use a development set, or development sets, to assess and improve candidate prompts, models and model configurations.
How much data do I need?
If we only have a small number of positive examples of an attribute, the fact that an automated process extracted the attribute correctly can only tell us a small amount about how often we expect it to extract that attribute correctly beyond the data we have tested the process on.
The more examples we have, the more confident we can be that the automated process will extract that attribute correctly most of the time.
Given that many metrics are simple proportions of true/false positives/negatives, we can use binary confidence intervals as a simple way to illustrate the confidence intervals we have around a metric we estimate.
For example, if we had 10 examples of a class, and 8 of those were correctly identified, we would say that we have 8 true positives, and 2 true negatives
Given that
We can calculate a 95% confidence interval around our estimate recall as follows:
from statsmodels.stats.proportion import proportion_confint
tp, fn = 8, 2
conf_int = proportion_confint(
    tp, tp+fn, alpha=0.05, method='beta'
)
conf_int
(0.4439045376923585, 0.9747892736731666)In other words, we are 95% sure that the interval 0.44-0.97 contains the true value of recall.
To show how these confidence intervals shrink as the number of samples grows, we can calculate a 95% confidence interval for an increasing number of samples, assuming that an automated process extracts each of these correctly.
import matplotlib.pyplot as plt
fig, ax = plt.subplots()
for n_samples in range(1,40):
    lower_bound, upper_bound = proportion_confint(
        n_samples, n_samples, alpha=0.05, method='beta'
    )
    ax.bar(n_samples, upper_bound - lower_bound, bottom=lower_bound, color='grey')

ax.axhline(0.9, color='black', ls='--')
ax.set_ylim(ymin=0)
ax.set_xlabel('True positives')
ax.set_ylabel('Estimated recall (95% CI)')
plt.show()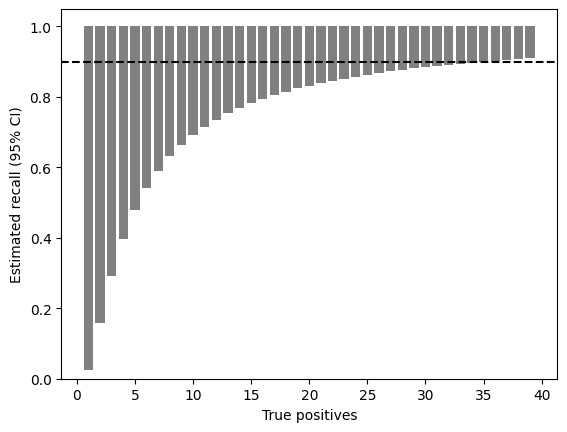
As the graph shows, we would need to extract almost 40 out 40 instances of a class correctly, before our 95% confidence interval around our estimation of recall would exclude 90%.
In other words, if we want to be very sure that our automated process works correctly, we may need a lot of data.
However, though we are used to 95% confidence levels in other areas of science, such high levels may not be appropriate here. Repeating the same analysis with a 50% confidence interval reduces the size of the interval substantially.
import matplotlib.pyplot as plt
fig, ax = plt.subplots()
for n_samples in range(1,40):
    lower_bound, upper_bound = proportion_confint(
        n_samples, n_samples, alpha=0.5, method='beta'
    )
    ax.bar(n_samples, upper_bound - lower_bound, bottom=lower_bound, color='grey')

ax.axhline(0.9, color='black', ls='--')
ax.set_ylim(ymin=0)
ax.set_xlabel('True positives')
ax.set_ylabel('Estimated recall (50% CI)')
plt.show()
In summary, the amount of annotated data we need depends on
the level of confidence we want to have
the minimum level acceptable for our metric
the actual level we can achieve on our metric
the prevalence of the attribute in our dataset
We can define a function to give us the minimum dataset size required to give us confidence in a given level of performance.
def calculate_required_dataset_size(
    min_confidence,
    min_recall,
    actual_recall,
    prevalence
):
    # TODO calculate required dataset size
    return
Chunked evaluation data
If we are to use automated data extraction to save human labour, then we will want to manually extract data from as few records as possible. It is not realistic, therefore, to use a large number of annotated records as our development set, at least not straight away.
If we assume that the more annotated records we have, the better we are able to use these to engineer effective prompts, then using more records for development than we would like to annotate in a live project would make us over-optimistic about our ability to develop effective prompts to automate data extraction tasks.
A more realistic alternative is to approach prompt development using small batches of manually extracted data. A version of this approach was used in Homiar et al., 2025
In the figure below, we define a process for a batched approach to prompt development and evaluation.
In this process, we start with an initial batch of documents that have had data extracted manually. We develop prompts on this data until either the performance has achieved a level we are satisfied with, or until continued iteration yields no further improvement. In order to to evaluate our chosen prompting strategy on data it has not been optimised for (to prevent overfitting), we then evaluate it against a new batch of documents. If this evaluation yields a performance score we are not happy with, then we add these documents to the development set and continue iterating on our prompts using the expanded set.
Once we have achieved an validation performance that we deem satisfactory, we then draw a final held-out test set and evaluate our performance using these.
Multiple testing
Using only one final held-out test set mitigates the risk of multiple testing, but we could end up in a situation where our evaluated performance is less than what we deem satisfactory. It would be better if we could continue annotating documents and test again, but we would need to account for the risks of multiple testing.
- Homiar, A., Thomas, J., Ostinelli, E. G., Kennett, J., Friedrich, C., Cuijpers, P., Harrer, M., Leucht, S., Miguel, C., Rodolico, A., Kataoka, Y., Takayama, T., Yoshimura, K., So, R., Tsujimoto, Y., Yamagishi, Y., Takagi, S., Sakata, M., Bašić, Đ., … Cipriani, A. (2025). Development and evaluation of prompts for a large language model to screen titles and abstracts in a living systematic review. BMJ Mental Health, 28(1), e301762. 10.1136/bmjment-2025-301762